Home » Data Collection

Category: Data Collection

2 1024x576 Featured Image

Audit Tool: Calculate the Time that a Data Collector takes per Question using ODK

One question that many M&E officers or information managers ask when collecting data in KoboToolbox or ODK, is “How long did the enumerator spend on each question?”  To track this, you can use a tool called an “audit log” in your XLSForm questionnaire.

It might be easiest if you want to watch a video tutorial on how to use this tool.  Here’s the video showing you all about the simple audit tool:

You can download the XLSForm template I used in the video (with “audit” in the metadata) from here.free template xlsform with audit metadata

Why would you want to know how long questions take in ODK?

  • you might want to see if enumerators are filling in information too fast
    • For example, they might be filling in data from memory after having a conversation with their interviewee.  This might not be a problem for some settings, but for a more robust survey, you might need them to fill in the answers as they go through the survey.
  • you might want to see if enumerators are getting stuck on a particular question
    • For example, is your questionnaire design causing delays?
  • what do you use it for?  I’d love to know!
    • one person told me he needed to track how long people spent on each question because he was running an IQ test using ODK, so needed to track how long people spent per question!

Add an Audit Question to your XLSForm

  1. The first step to take when you want to track the time it takes for a data collector to collect an answer is to open up your XLSForm.
  2. I always put a “metadata” section at the very top of all my questionnaires.  This includes a start time, end time, today’s date, email, username of the data collector, etc.
  3. In your metadata section, under the “type” column, add “audit”.
  4. And then under the “name” column, add “audit”.
  5. If you want the example form I used for the video tutorial, get it here.

template for audit

Put your Form on ODK Collect

  1. Upload your XLSForm to your server (such as KoboToolbox).
  2. On your ODK Collect app (or Kobo Collect app), tap on “Get Blank Form”.  Find the new questionnaire you’ve added to your server and download it to your app.
  3. Now tap on “Fill Blank Form” and you’ll be ready to collect the data.

Fill in your form on ODK Collect

  1. Go ahead and collect your data!

Download your data from Kobo Toolbox (or other server)

  1. Download the normal “XLS” style of data download (the same as you normally would).
  2. Then download the “Zip attachments” for your form.

Open your audit log

  1. In your main data file, you’ll see there’s a uuid column.  Every row of data will have a UUID (a random, unique identifier) for each submission.
  2. In your Zip file that you downloaded – you’ll find folders named with that UUID.
  3. Find the equivalent UUID folder, and find the “audit” file that’s in there.  Open it up.

Add a column named “time-elapsed”in the Audit file

  1. Add a column named “time-elapsed” in your audit log.
  2. Then create a formula like this:
    • =(d2-c2)/1000
  3. This will give you the elapsed time in seconds that was spent on each question!


Good luck – let me know in the comments below how you’re using the audit log, and if you have any questions!


YouTube Thumbnail Disability Featured Image

Collect Disability Data using the Washington Group Short Set

Do you disaggregate your data by disability status, whether you’re collecting monitoring data or programme activity data? In this article and tutorial video, I show you how to use the Washington Group Short Set of Questions on Disability and how to programme them into XLSForm so you can collect disability data using KoboToolbox or ODK.

Watch this video below as I show you how to programme these questions into your questionnaire so you can easily collect disability data:

And if you want the templates I use in the video, go get them here.

Follow these steps to create your own set of disability questions in KoboToolbox:

Short Set of Questions to Collect Disability Data

  1. Open up this website and find the Washington Group Short Set of Disability Questions.
  2. It’s a very short 6 questions that gives you the wording to collect disability data around six different health problems:
    1. difficulty seeing,
    2. hearing,
    3. walking or climbing steps,
    4. remembering or concentrating,
    5. difficulty with self care, or
    6. difficulty communicating in your usual language  (or being understood).

1. Create your XLSFORM (using a Field list)

Free template image for disability template

Open up your XLSForm where you’re creating your questionnaire.

In the “survey” tab:

  1. The “label” column is where you want to put the six questions. Copy and paste the six questions into the label column.
  2. Then in the “type” column, make them each a select_one question, and call the choice list “healthproblem” or something similar.
  3. Use the same type of question for all six questions.
  4. In the “name” column, give each of the questions a unique variable name, such as “seeing”, “hearing”, “walking”, “remembering”, “self-care”, and “communicating”.
  5. Now make a choice list under your “choices” tab.
  6. Copy the choice list name from your “select_one” question type, and go into the “choices” tab.

In the “choices” tab:

  1. Create a new list with “healthproblem” as the list_name.
  2. Then in the label column, enter
    1. “No, no difficulty”
    2. “Yes, some difficulty”
    3. “Yes, a lot of difficulty”
    4. “Cannot do it at all”
  3. In the name column, enter equivalent names, except with no spaces, no capital letters, no special characters:
    1. nodifficulty
    2. somedifficulty
    3. lotofdifficulty
    4. cannotdoatall.

Make your six disability questions into a “group”

This set of steps might get confusing – go grab the templates here if you need.

  1. Then, back in the “survey” tab, make the six questions into a group of questions so that they all show up on the same page in ODK Collect or Kobo Collect.
  2. Enter “begin group” in the type column before your set of questions.
  3. Enter “disability” in the “name” column for your group.
  4. And “end group” and “disability” after your set of six questions.
  5. TIP for groups:  I like to colour the Excel rows where I have “begin group” and “end group” so that I can see at a glance where my groups are in my XLSForm.
  6. Now go to the “appearance” column of your group.
  7. Enter “field-list” as the appearance.  That means that all the questions in this group will show up on the same page in ODK Collect or Kobo Collect when you go to collect disability data from respondents.

A couple last finishing touches:

  1. Now, add one more row at the top of your group of questions.  Enter “note” in the “type” column.
  2. Give your note a name in the “name” column, such as “healthproblem-note”
  3. Then copy the introduction statement from the Washington Short Set of Questions and paste that into the “label” column of the note.
  4. Then add a hint.  Enter “Read this statement out first.” in the hint column.
  5. Lastly, make sure that each of the six questions are “required” – so enter “yes” or “TRUE” into each question, under the “required” column.

2. Create your XLSFORM (using a table list)

There is one other way you could display this set of questions using a “table-list”.  It shows the questions a little bit differently on the screen of the mobile device or computer screen when you’re collecting the disability data.  It works better on a larger screen.  If you just have a small mobile phone that you’re using to collect the data, you can try it out and see if it looks good.

  1. So, add another “group” (using begin group and end group – see steps 14-16 above) around the six questions.
  2. Where you’ve entered “begin group”, enter “dis_table” into the “name” column.
  3. Where you’ve entered “end group”, enter “dis_table” into the “name” column.
  4. Then, in the appearance column of this new group, enter “table-list”.
  5. In KoboToolbox or ODK Collect, your set of questions will appear down the left-hand side.  Your possible answers will come across the top.  It looks like a table on your screen, and you have radio buttons that you can quickly select answers for each question.

Hope that was a helpful tutorial about how to collect disability data for your programme.  Please download the template and use it in your programme if you want! Download a free template for collecting disability data

how to add geopoint, geotrace, and geoshape to QGIS

Add Geopoint, Geotrace, and Geoshape to a QGIS Map

When you collect geopoint, geotrace, or geoshape data using ODK Collect or KoboToolbox, you can display them in QGIS.  In this article, I’m going to show you very quickly how to do that.

Now, if you want to know how to collect these kinds of GPS data questions using ODK or KoboToolbox, go check out this article first.  Or you could also download a template XLSForm questionnaire for collecting geopoints, geotraces, and geoshapes.

Once you’ve collected the GPS data…

How to Display GEOPOINT Data in QGIS

Please watch this video to follow along.  Below the video you’ll see I’ve given you step-by-step instructions which are demonstrated in the video.

  1. Open KoboToolbox.
  2. Go into the project you’re interested in.
  3. Go to “Data”.
  4. Then go to “Downloads”.
  5. Select “CSV”.
  6. Click Export.
  7. Click on the little download button when your export is completed.
  8. Now go into QGIS.
  9. Click on layer – add layer – add delimited text layer.
  10. Select the file you want to import.
  11. Choose Custom Delimiters.
  12. Choose Semicolon.
  13. And make sure you put “ in Quote.
  14. Then make sure the X Field is your longitude of your geopoint.
  15. And make sure the Y Field is your latitude of your geopoint.
  16. Your reference system could be similar to mine, I’m using WGS 84.
  17. And click add.
  18. From your Browser, go to XYZ tiles.
  19. Right click, and choose “New Connection”.
  20. Give it a name like “OpenStreetMap”, and type in the connection URL:  http://a.tile.openstreetmap.org/{z}/{x}/{y}.png
  21. Drag OpenStreetMap XYZ tile down into your project.
  22. You can now check to make sure it’s showing up in the right location.
  23. Now, from here, you can add other elements to your map!

Next up, what if you collect geotrace data instead of a geopoint…

How to Add GEOTRACE Data to QGIS

Here’s the video that demonstrates how to add geotrace data to your QGIS map.  Below the video are step-by-step instructions on how to add geotrace data to QGIS.

  1. Download your data file from KoboToolbox or ODK that has collected geotrace data.
  2. Find the column where your geotrace data is showing.
  3. Open QGIS.
  4. Go to plugins.
  5. Click on “manage and install plugins”.
  6. Start typing “ODK”  and you’ll see “ODKTrace2WKT”
  7. Click on Install Plugin and then Close.
  8. Go to Plugins  – “ODKTrace2WKT”  – click on the plugin.
  9. Select the input file.
  10. Select the column with the geotrace data.
  11. Leave the delimiter as the semicolon.
  12. And click OK.
  13. It creates an output layer that you can now see on the map.
  14. Right click on the “Output Layer”.
  15. Choose “Export”, and “Save Features As”
  16. Click on the little three dots, choose a file location and name the file.
  17. Then make sure it will add the file to the project you’re in, and click OK.
  18. Now right click on the Output Layer and click “Remove Layer” – which means you’re going to be working with the right layer from now on.
  19. And that’s how you add a geotrace very easily to a QGIS map!

Next up, what if you collect geoshape data:

How to Add GEOshape Data to QGIS

Here’s the video that demonstrates how to add geoshape data to your QGIS map.  Below the video are step-by-step instructions on how to add geoshape data to QGIS.

  1. You have downloaded a file from Kobo Toolbox or ODK Collect that has collected geoshape data.
  2. Go into QGIS.
  3. Go to plugins.
  4. Click on manage and install plugins.
  5. Start typing “ODK”  and you’ll see “ODKTrace2WKT”
  6. Click on Install Plugin and then Close.
  7. Go to Plugins – “ODKTrace2WKT” – click on the plugin.
  8. Select the input file.
  9. Select the column with the geoshape data.
  10. Leave the delimiter as the semicolon.
  11. And click OK.
  12. It creates an output layer that you can now see on the map.
  13. Make sure that “Output Layer” is selected as a layer.
  14. Then go to Vector – Geometry Tools – Lines to Polygons.
  15. Input layer should be your “Output Layer”.
  16. Then click “Run in Background”.
  17. Then click Close.
  18. You can see it’s now created shapes from those lines that were imported from Kobo Toolbox or ODK.
  19. Right click on the “Polygons” layer.
  20. Choose “Export”, and “Save Features As”
  21. Click on the little three dots, choose a file location and name the file.
  22. Then make sure it will add the file to the project you’re in, and click OK.
  23. Now right click on the Polygons layer and click “Remove Layer” – which means you’re going to be working with the right layer from now on.
how to collect GPS data

How to Collect GPS Data using ODK Collect and KoboToolbox

How do you collect GPS data using KoboToolbox or ODK?  In humanitarian and development work, it’s common to collect GPS locations to map your information.  Maybe you need to map village locations. Or maybe you’re mapping remote “roads” that don’t show up on any road map you have.  You might even need to map farmers’ fields if you’re running an agriculture project. These various types of geographical data can be summarized as:

  • Points:  you collect a single point, like a village location, or a household location, or a latrine location.
  • Lines: you collect a series of points in a row that all get joined together into one line.  This could be something like a road, a path, a river, etc.
  • Shapes (Polygons): if you have to collect data on an area, such as the shape of a building, or the area of a farmer’s field, or the outline of a refugee camp, for example, you would look at collecting a shape.

All these types of GPS data can be collected using KoboToolbox and ODK Collect.  Watch this video as I walk you through how to set up your questionnaire in XLSForm, then show you how to collect GPS data on the ODK Collect app:

Download the XLSForm Template that I show you in the video by clicking here.

FREE TEMPLATE - XLSForm to Collect GPS points, lines, and shapes

Here’s a step-by-step method for collecting GPS data using ODK Collect and KoboToolbox:

  1. Create your questionnaire using XLSForm.

If you want to know how to setup a blank template for creating questionnaires in XLSForm, you can check out this other blog article on creating a blank XLSForm template.

If you want to download the XLSForm questionnaire I used in the video, click here.

  1. Create a question for “geopoint”

When you collect a GPS point, then the “type” of question you create in your XLSForm is a “geopoint”.  Then give that question a “name” and a “label” and a “hint” (if you want).

You can leave the “appearance” column blank, or you can use a “maps” appearance or a “placement-map” appearance.

A “maps” appearance just shows a map in the background as ODK Collect collects your GPS point.

A “placement-map” appearance allows you to tap anywhere on a map to collect a GPS point anywhere you want (not necessarily just where you’re standing).

If you want to read more about collecting a geopoint, then check out the ODK documentation here.

  1. Create a question for “geotrace”.

When you collect a GPS line, then the “type” of question you create in your XLSForm is a “geotrace”.  Give that question a “name” and a “label” and a “hint” (if you want).

Leave the “appearance” column blank.

If you want to read more about collecting a geotrace, then check out the ODK documentation here.

  1. Create a question for “geoshape”

When you collect a GPS shape, then the “type” of question you create in your XLSForm is a “geoshape”.  Give that question a “name” and a “label” and a “hint” (if you want).

Leave the “appearance” column blank.

If you want to read more about collecting a geoshape, then check out the ODK documentation here.

  1. Upload your XLSform questionnaire to your KoboToolbox server (or whatever server you’re using).

Don’t forget to “Deploy” the form so that you can download it onto your Android device.  If you haven’t used KoboToolbox and ODK Collect before, then you can take this free course on getting started with KoboToolbox and ODK.

  1. Get the blank form on your mobile phone using the ODK Collect app.

Make sure you’ve connected your ODK Collect app to your KoboToolbox server.  Then hit “Get Blank Form” and download your questionnaire onto your phone.

Once again, if you haven’t used KoboToolbox and ODK Collect before, then you can take this free course on getting started with KoboToolbox and ODK.

  1. Collect your point.

Tap on “Start GeoPoint” to start collecting your GPS point.  Your phone will take a few moments to connect to some satellites so it can establish the GPS location.  The app will tell you how accurate it’s GPS reading is.  Wait until the accuracy is good, for example 10-20 meters, before you tap on “Save GeoPoint”.

  1. Collect your line.

You can collect a line like I do in the video, by just walking along the line, and having the phone automatically collect points every few seconds.  However, you can also manually collect points along the line.  Do what works best for your situation!

To read more about collecting geotrace data, then read further documentation here.

  1. Collect your shape.

You can collect a shape like I do in the video, by just walking around the shape, and having the phone automatically collect points every few seconds.  However, you can also manually collect points along the outline of the shape.  Do what works best for your situation!

To read more about collecting geoshape data, then read further documentation here.

If you’re interested in how to visualize all that data using QGIS, I’ve got a video and tutorial coming out next week to show you how.  So make sure you’re subscribed to my mailing list to get the weekly tutorials!


DIY Guide Blog Banner (9)

Prevent Selecting “None of the Above” with any Other Option – XLSForm Constraint Tutorial and Template

I want to share with you a useful XLSForm constraint that you can use when you create digital questionnaires for Kobo Toolbox, ODK, Ona, or SurveyCTO.  Someone recently asked me this question:

“How can I create a constraint such that respondents can’t select “I don’t know” and another option.  I want to create a constraint that prevents selecting “I don’t know” and any other option from a multiple_select question.”

This is such a good question.  And it is very common in humanitarian and development questionnaires, where we give a list of options and say “select ALL that apply”.  And then at the bottom of the list, we might have options like:

  • Not applicable
  • I don’t know
  • None of the above

But it wouldn’t make sense if the questionnaire allowed you to select “None of the above” with another option also.

So…there is a great constraint that you can use in your XLSForm to prevent this from happening.

Please watch this video to see the full explanation of how to create the constraint and how to construct the formula!

If you want to download the XLSForm Constraint Template, click here to go get your download.

Free Template Download

What this XLSForm Constraint is Trying to Prevent

  • We don’t want to allow anyone to select “none of the above” when they’ve selected any other answer.

Or we could also say…

  • We don’t want to allow anyone to select “none of the above” when they’ve selected more than one answer.

When we emphasise “more than one” answer, it indicates that part of the logic of our constraint will be looking at counting how many answers the respondent selected.  So let’s dig in…

Set Up the Question in XLSForm

Slide2

The important elements of the question set-up are as follows:

  1. It applies to a “select_multiple” question
  2. The choice list is under the “choices” tab.
  3. Options include choices such as “I don’t know”, “none of the above”, or “not applicable”
  4. The respondent sees the “label” for each option when he or she fills out the questionnaire
  5. The “name” for each label – is the variable name used in the constraint to refer to that option

Two Parts to the XLSForm Constraint FormulaSlide3

The first part of the formula that you need to know is:

selected(.,'none')

You can read more about this function on the OpenDataKit website.  It means that the respondent selected the choice “none” in the question that they’re currently answering. The “.” refers to the answer currently being input into the questionnaire.

Slide4

The second part of the formula that you need to know is:

count-selected(.)>1

You can read more about this function on the OpenDataKit website.  However, the main interpretation is that the form will count how many choices were selected in the current question, and it will check if that count is greater than 1.

So there is a Problem when…

The problem occurs when the respondent has

selected(.,'none') and count-selected(.)>1

The “and” means both these things have to be true for the problem to exist.  So, if the respondent hasn’t selected none, then it’s okay if count-selected(.) is greater than one.

 Writing the Final XLSForm Constraint

You can use “not()” in the XLSForm constraint formula to show that this situation is “not allowed” to occur when the form is being filled out.  The full constraint formula is:

not(selected(.,'none') and count-selected(.)>1)

The interpretation of that formula in plain-English would be: you are “not allowed” to “select none” if you’ve “selected more than one choice”Slide10

Enter this formula into the “constraint” column of the XLSForm.  If you want to know how to create your own Blank XLSForm Template, you can learn how to here.

Take a Random Sample Using Excel's RAND Function

RAND Function in Excel to Choose a Random Sample

Do you ever have to report on an M&E outcome indicator and give a percentage, for example, 70% of the population was impacted?  How do you figure out what that percentage is?  A lot of the time you’ll base that number on the results of a survey.  But for your survey results to be valid, you need to choose your sample randomly.  Then RAND function in Excel can help you do this!

This post is all about how to choose a random sample when you’re doing a survey (like a baseline or endline).  It includes:

  • How to use a “Sample Size Calculator”
  • How to use the RAND function in Excel to help you choose your list of people to interview
  • And how the “Bernoulli Distribution” can help

A Lot of People Don’t Do Random Sampling (and they probably don’t use the RAND function in Excel either)

I know this sounds boring, but you know what?  A lot of people don’t do random sampling when they carry out an assessment.  And it bugs me.  Because when you choose a random sample, your assessment results are more reliable and more professional.  As much as possible, you’ve removed the bias from your sample selection so that your survey produces good data.

Are you using random sampling already?  Or could you start doing it in your next assessment?

The ONE mistake many people do when carrying out a “survey” is they don’t do a random sample…

…and yet they still report percentages as if their results apply to the whole population.

If you don’t do random sampling, your results are literally percentages that apply only to the people you interviewed. The results are not generalizable to the rest of the population you’re interested in.

I’ve made a video explaining how to choose a random sample using Excel.  But first, please download the Excel template I use in the video so you can follow along and use the template when choosing the sample for your next survey.

Free Template Select Random Sample using RAND Function in Excel

For those of you who just want a written tutorial, I’ve broken it down into a few steps which I’ll summarize here:

Step 0 – What is your “population”?

Before you report on it, you have to define who exactly is in your population.  The random sampling method I describe here assumes you have a complete list of all the people you need to report indicators on.  For example:

  • if you’re running a training programme, your “population” might be the entire list of all the trainees who have been through your programme this year.  So your total population would be “total number of people trained”.
  • if you’ve done household distributions of hygiene items, food, or cash, your population would be the entire list of households that have received a distribution.  Your population would be “total number of households reached”.
  • if you’ve done a community WASH programme, your population would be the entire list of all households in the village or villages you’ve reached.  Your population would be “total number of households in the community(s)”.

But this methodology assumes you can make a list in Excel of every single household or ID number or name that’s in the whole entire “population” of your targeted beneficiaries.

Step 1 – What is your “sample size”?

To get a percentage for your M&E indicator, you need to do a survey such as a baseline or endline.  You could go to every single household or person in your population and ask your survey questions.  But this might be a waste of time, money, and resources.  Instead, you could define a “sample” (or subset) of your population – and if this sample is chosen randomly, then the results from only asking some people will be similar to the results of having asked every single person.

To calculate a sample size, you should use an online Sample Size Calculator, like this one.

  • It will ask you to plug in your “population size” (see Step 0).  For my example, I’m using a pretend population of 300 households.
  • Then it will ask you to choose a confidence interval.  Typically, you’ll probably use a confidence interval of 90% or 95% (most commonly 95%).
  • Then it will ask you to choose a margin of error that you’re okay with.  Most of the time, you’ll probably choose 5%.  If you’ve got really difficult access constraints (depending on your context) or a very low budget, then you might choose something like 10%.

When you press “calculate” it will then calculate a sample size for you.  In my example with a population of 300, 95% confidence interval with a margin of error of 5%, my sample size would be 169 households to interview.

Step 2 – Prepare for Interviewees Who Aren’t Available for the Interview

What if you choose a sample to interview, but then someone isn’t available when you go to interview them?  How do you prepare for this before you begin your survey?

The easiest way to do this is to assume that a certain percentage of people will be no-shows.  This is all dependent on context.  If you can ask around your team, colleagues, or other organisations who have worked in the area before, they might be able to give you an idea of the number of people who are might be unavailable on any given day.

For example, I usually assume 15% or 20% of people won’t be available on the day of interviews.

Then you just multiply your sample size by your percentage of no-shows.  (so, 15% x 169 households = 25 households)  Now, add that many people on top of your sample size to get the total number of people you need to select for an interview. (so, 25 + 169 households = 194 households to interview).

Free Template Select Random Survey Sample using the RAND Function in Excel red

Step 3 – Calculate Probability of an Interview

The next quick little calculation you want to do is calculate the probability of a person being chosen for an interview.  To do this, divide the number of people or households you need to interview (from step 2) by the total number of people in the whole population.  In my example, this would be 194 divided by 300.  This results in 64.783%.  So, this means that any one person in the population has about a 65% chance of being selected for an interview.

Step 4 – Use the RAND Function in Excel to Randomly Select People to Interview

Because of a nice little statistical distribution called the “Bernoulli” distribution, you can now use the RAND function in Excel to randomly select people from your population list to interview.

  • the RAND function in Excel produces a random number between 0 and 1.  To see this in action, just type it into an Excel cell like this:
=rand()
  • Because it produces numbers totally randomly, then about 50% of the time, it will produce numbers that are 0.5 or below.  and 60% of the time it will produce numbers that are 0.6 or below.  And 20% of the time, it will produce numbers that are 0.2 or below.  Do you see the pattern?
  • So we can use the probability we calculated in Step 3, combined with the Bernoulli distribution, to write the following formula next to each name in our population list:
=if(rand()<$B$2,"yes","no")
  • in the cell B2, place the “probability” we calculated in step 3.
  • This formula will check the random number generated by RAND().  If the random number is equal to our probability or lower, then it will say “yes” we should interview this person.  Or else, if it’s higher than our probability, then it will say “no”, we shouldn’t interview this person.
  • If you want to learn more about the “if” function and the nested if function, check out my other tutorial here.

Free Template Select Random Survey Sample using the RAND Function in Excel green

Step 5 – Make Sure you Copy your RAND function in Excel and “Paste Special” as “Values”

Every time you refresh an Excel formula, or refresh a spreadsheet, all of the formulas recalculate, and all of the random numbers generated by RAND() will change.  So it’s important to copy your random interview selection list and “paste special” as “values” so it doesn’t change.

Step 6 – Double Check your Total Number of Interviewees Using a Pivot Table

Because we’ve used a random number generator, we’re never sure exactly how many names from your population list it will select for you to interview.  It should be very close to the number you calculated in Step 2, however it might be a little higher or a little lower.  Use a Pivot Table to summarize how many “yes’s” it calculated to interview and how many “no’s” it calculated.  Is the number of “yes’s” close to the number of people you need to interview?  If so, great.  If not, you might want to refresh the RAND() formula again and check the new calculation.

For example, I calculated that I needed to have about 194 people on my interview list in Step 2.  Using the RAND() formula, Excel randomly selected 195 households for me to interview.  Okay.  Close enough.  Or if it had selected 193 households to interview, fine.  But perhaps if it only selected 188 or 205 households, then I might refresh the formula to get a selection closer to my target from Step 2.

Steps 7 & 8 – Produce the FINAL Interview List

Filter your household list, select all the people that had a “yes” to be interviewed.  Copy that list to a final Excel spreadsheet and produce the FINAL list of people to interview.

These people were selected randomly, so the percentage results you get from them should apply to your ENTIRE population.


If you’re still reading, you’re amazing.  This was a long and detailed tutorial.  I really hope you watch the video explanation and download the Excel template. Use them to follow along, and maybe even use the Excel template for selecting interviewees for your next survey!

How To Collect A GPS Point YouTube Thumbnail

How to add a GPS question in a Kobo Form

This short tutorial is all about how to add a GPS data collection question to your Kobo Toolbox form.

Why collect GPS points?

  1. To show project locations or infrastructure locations on a map. To do that, the easiest way is to collect the GPS points so they can be easily added to a mapping software later.
  2. Verify the location that the data was collected from. Sometimes, you can use extra data, such as GPS points, timestamps, or images, for example, to verify that the data being collected is correct.  This is called data triangulation or verification.  And it’s very useful in humanitarian settings when you might need to prove to your donors or partners that your data is of high quality.

So how do you add a GPS question to your Kobo form?

Watch this video to find out!
Here are the steps to follow:

1. Set up a new data collection form

1. Set Up A New Data Collection Form

  1. From within Kobo Toolbox, click the big blue button that says “new”.
  2. Then click “build from scratch”.
  3. Give your new form a name, description, sector, and country, and then click “create”.
  4. You now have a blank form.

2. Create a GPS question

2. Create A GPS Question

  1. Now click the “plus” button, and type a question, such as “Please collect a GPS point.”
  2. Click “add question”.
  3. Then click “point” because it’s a point question.
  4. Now save the form.

3. Make the GPS Question Mandatory (if you want)

3. Make The Question Mandatory

  1. Press “settings” (the little gear icon) on the question that you’ve created.
  2. Make the question mandatory by clicking the tick box next to “mandatory response”.
  3. You can leave the tick box blank if it’s not mandatory for the data collector to fill out this question.
  4. Now save the project again and hit the “X” to exit.

4. Deploy the Form

4. Deploy The Form

  1. You’re now in your “Form” overview page.
  2. Next, click “deploy”.

5. Collect GPS Data using the Webform

5. Collect GPS Data Using The Webform

  1. Under the section “Collect data”, click on “open”.
  2. You will now see the webform.
  3. Your web browser should ask permission to know your location.  Click “allow”.
  4. Now, click the little locator button that says “detect current location”. It will input the latitude and longitude as well as accuracy of your location.
  5. Now scroll down and click “submit”.

6. Collect GPS Data using your Mobile Phone

6. Collect GPS Data Using ODK Collect App

  1. Open the ODK Collect app (or Kobo Collect app) on your phone, and tap “get blank form”.
  2. The app will connect to the server.  Choose the “GPS question” form and tap “get selected”.
  3. Once it downloads the form, hit okay.
  4. Tap on “fill blank form” and then tap on the “GPS question” form.
  5. Collect a geopoint by tapping on the grey button within your form.
  6. Once your phone has connected with the satellites, tap “save geopoint”.
  7. Swipe forward, then tap on “save form and exit”.

And that’s it. That’s how you can create a GPS question using the Kobo Toolbox Form Builder, and then fill that in either using a webform or using a phone app such as ODK Collect.


You might be interested in checking out a couple other mobile data collection articles:

8 Ways to Check your Data Quality when using ODK or Kobo

Mobile Data Collection isn’t only for Surveys…11 Ideas for your Team


Mobile Data Collection

Mobile Data Collection isn’t only for Surveys…11 Ideas for Your Team

Collecting good digital data is so important to running an accountable programme. When do you do mobile data collection in YOUR programme?

For Survey

Many programmes collect Mobile data in mainly two cases:

  1. For a survey (like a Baseline or Endline survey, or KPC or KAP survey)
  2. For Monitoring & Evaluation purposes (for example, after you’ve done a distribution)

But have you thought about all the other data collection you could/should digitize?

Here are 11 other ideas For Collecting mobile data:

Sign In Sheets

1. Sign-in or check-in sheets

For example, use a mobile phone sign-in form at your drop-in centre.

2. Distribution records

For example, when you distribute food, WASH kits, or basic needs kits, you can collect digital signatures using Kobo or ODK while you’re doing a distribution.  You could even use the “barcode” feature of ODK to scan vouchers or household ID barcodes.

3. Pre-and-Post training assessments

If you run trainings, you can can quickly measure the success of your training by using mobile evaluation forms.

4. Stock counts

Counting stock is something we all have to do at one point or another.  Maybe you could set up your warehouse with barcodes and scan them into your mobile data collection form.

For Monitoring

5. Clinic registers

If you work in Health or Nutrition sectors, you can use mobile data collection to record patient data, problems, and diagnoses.  Just be sure that you’ve got a good data protection protocol in place when you’re handling sensitive data.

6. Salary receipts

Especially when paying by cash, you’ll want to collect the time and place you paid someone.  You can even collect photographs or video so you have proof of payment.

7. Recording household visits

If you have volunteers or community workers who regularly visit households to teach different topics or run house groups, then you can set up a mobile data collection form that records basic info from the visit so you have an easy record to refer to.

8. Locations of community infrastructure

You can collect GPS points of water points, latrines, mosques, churches, clinics, and other infrastructure to make maps and improve your understanding of a location/context.

9. Audio files of interviews

If you’re doing semi-structured interviews or Focus Group Discussions, you can record audio files with ODK or Kobo (just in case your note-taking isn’t good enough).

10. Daily farming inputs/activities

If you’re running an agricultural project (like planting, fertilizing, spraying, etc), then you can develop a mobile form that records daily activities.

11. Water testing results

If you collect water quality results with mobile data, it will make it so easy to track water quality over time at different points.

Data You Should Digitize

12. When else should you do mobile data collection?

You tell me…what are other ideas for mobile data collection you think humanitarian teams should try?

Of course, once you have all that data, then the next question becomes…how do you manage or analyze it all (here are 7 ideas for analyzing demographic data)? But that’s for another day…

If you liked any of the ideas above and you want some help to implement them in your programme, please give me a quick email back and I’ll help you get setup (janna [a] humanitariandatasolutions.com)!

How to create xlsform template

How to Setup a Blank XLSForm Template

When you first start to design a digital questionnaire in XLSForm – which works for ODK, ONA, SurveyCTO, and many other mobile data collection apps – then you probably want to have a blank XLSForm template setup and ready to go.

Setting up a blank XLSForm template means that when you need to create a new survey for your team, you can get started right away.  It’s so easy, saves time, and makes your work flow so much faster!  You’ll look very professional in front of your colleagues (and your boss!).

Before we start – you can download our free template so you don’t have to create one from scratch!!Download Now XLSForm Navy

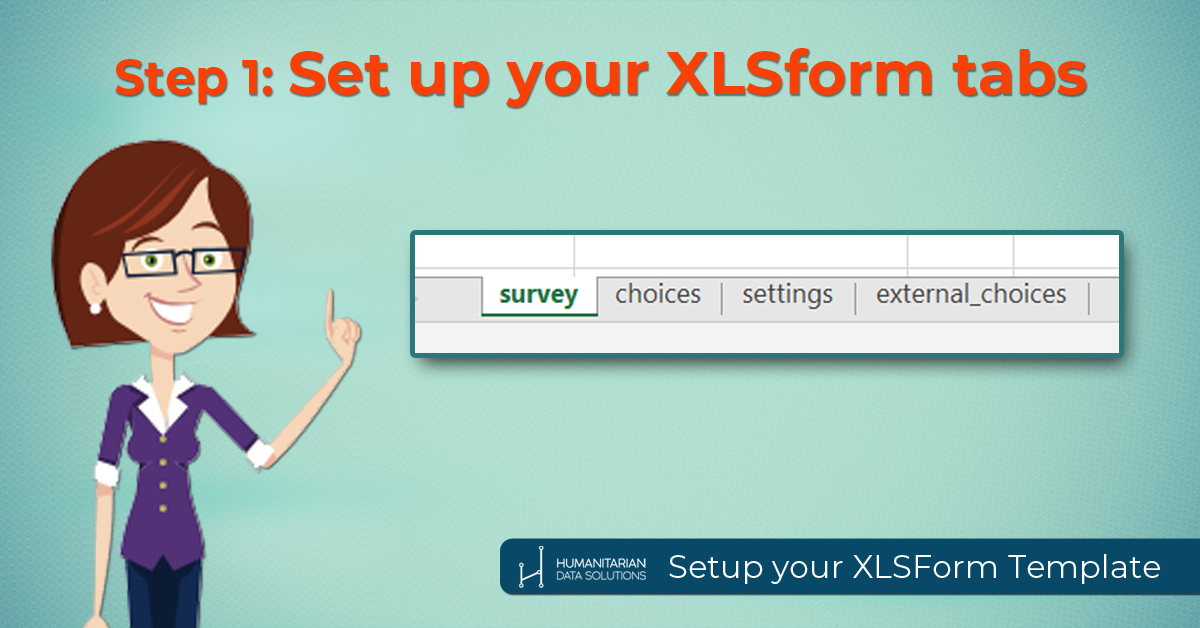
1.  Set up your XLSform tabs

Step 1 set up your xlsform tabs

  • Open a new Excel spreadsheet
  • Save it as “Blank XLSForm Template”
  • Create 4 tabs in your workbook and name them as follows
    • survey
    • choices
    • settings
    • external_choices

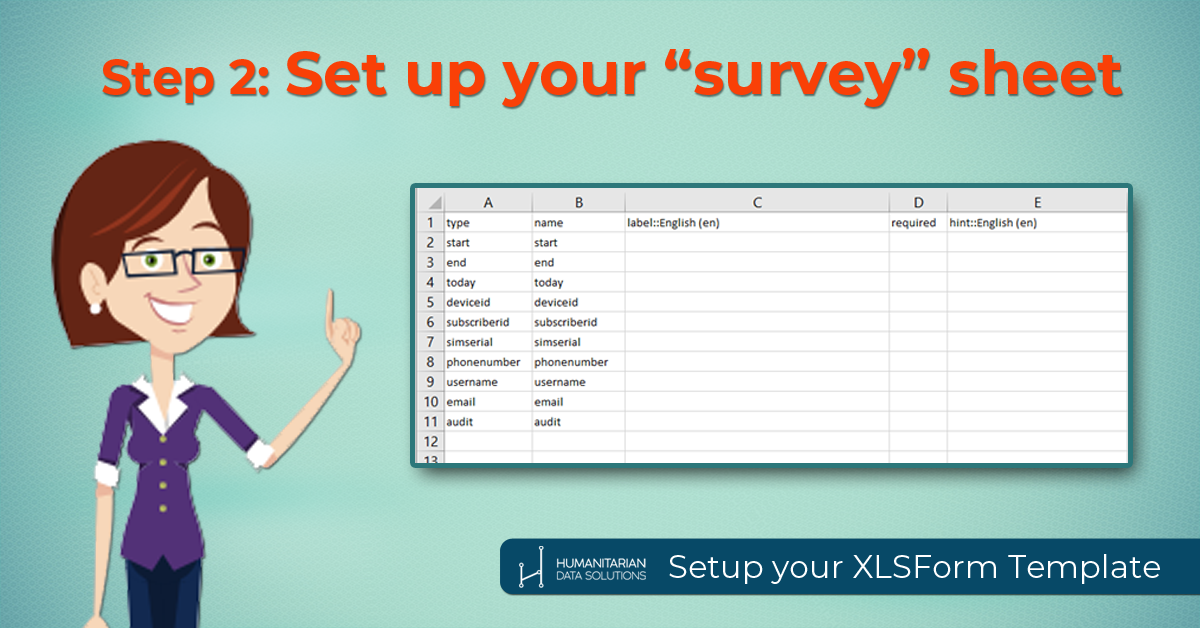
2. Set up your “survey” sheet.

Step 2 set up your survey sheet on xlsform template

  • In your survey tab, add all the possible column names across the first row of your sheet. Name the columns as follows:
    • type
    • name
    • label
    • required
    • hint
    • constraint
    • constraint_message
    • relevant
    • required_message
    • calculation
    • repeat_count
    • appearance
    • choice_filter
    • default
    • read_only
    • media::image
    • media::audio
    • media::video
    • body::accuracyThreshold

Download Now XLSForm Green

  • ODK keeps adding new column names to their software so that it has enhanced capabilities. Just in case they’ve added new columns recently, go check out the most up-to-date list of XLSForm column names in their documentation.
  • Set up your XLSForm template for multiple languages. In your survey tab, these are columns that can be translated into multiple languages:
    • label
    • hint
    • constraint_message
    • required_message
    • media::image
    • media::audio
    • media::video
  • If you frequently create surveys in more than one language, then amend those column names to show your primary language, and create additional column names with your language variations.
Column names (multiple languages: showing English, Arabic, and French)
Change column names with your primary language: Add new column names with your second language: Add new column names with your third language:
label::English label::عربى label::français
hint::English hint::عربى hint::français
constraint_message::English constraint_message::عربى constraint_message::français
required_message::English required_message::عربى required_message:: français
media::image::English media::image::عربى media::image:: français
media::audio::English media::audio::عربى media::audio:: français
media::video::English media::video::عربى media::video:: français
  • Now set up your “metadata” questions in your survey tab. These questions should be included on every new survey you create. That way you won’t forget to capture all the data possible about when each form was filled out and which device filled it out.
    • Under the “type” column and the “name” column, put in the following questions:
type name
start start
end end
today today
deviceid deviceid
subscriberid subscriberid
simserial simserial
phonenumber phonenumber
username username
email Email
audit audit
  • A new feature that ODK has recently added to their software is the ability to add an “audit” feature to surveys, which captures details about how a data collector moves through a form and how long each question takes, for example. In order for this piece of metadata to work, you need to be using ODK Aggregate 1.5.0+ as your server.

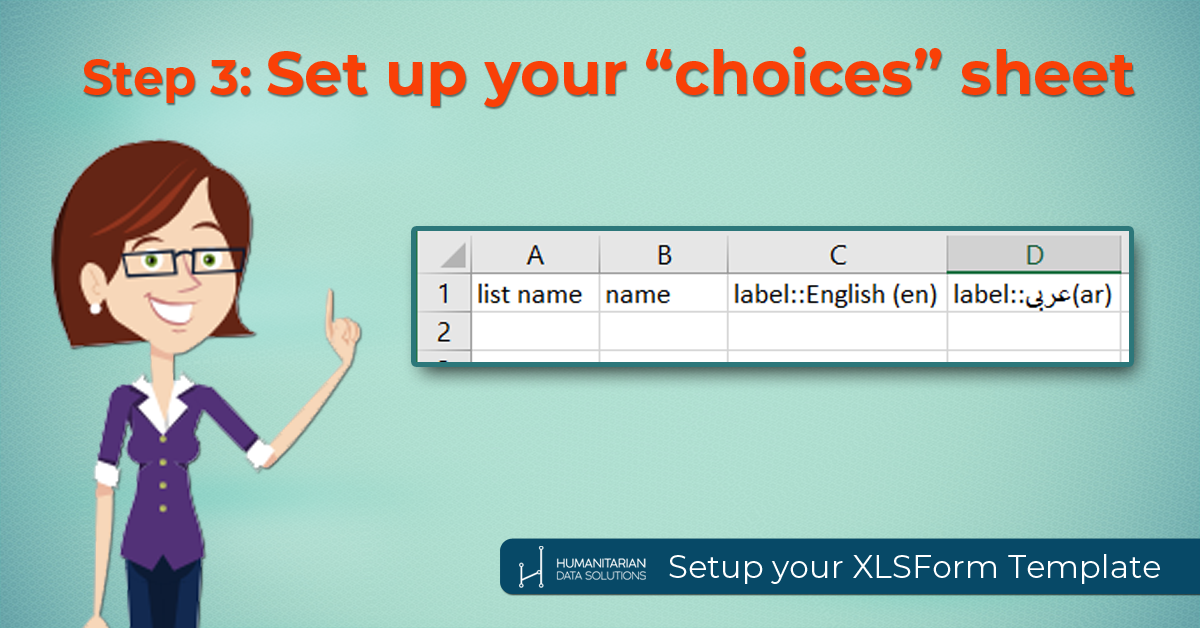
3. Set up your “choices” sheet.

Step 3 Set up choices tab in XLSform Template

  • In your choices tab, add all the possible column names across the first row of your sheet. Name the columns as follows:
    • list name
    • name
    • label
  • If you are using multiple languages in your XLSForm template, your “label” column can also be multi-lingual. Similarly to the “survey” tab, you can amend your “label” column name to be “label::English” (or whatever your primary language is), and then add additional columns with your additional languages.  You must spell these language names EXACTLY THE SAME as the languages you added in your “survey” tab.
Change column names with your primary language: Add new column names with your second language: Add new column names with your third language:
label::English label::عربى label::français

4. Set up your “settings” sheet.

Step 4 Set up settings tab in XLSform Template

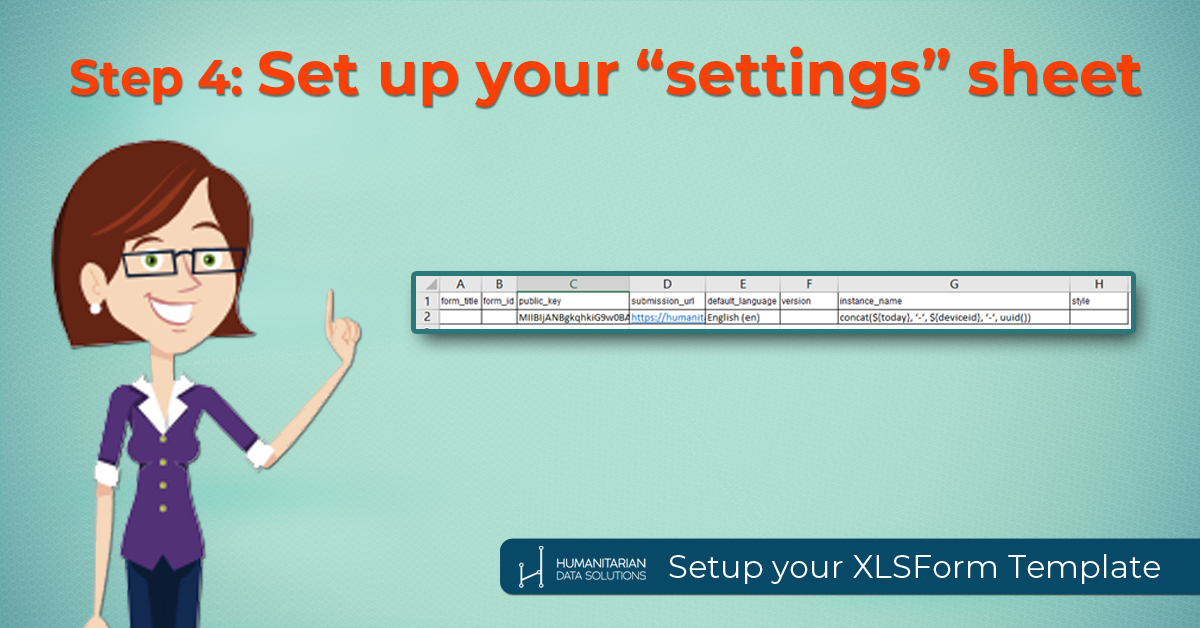
  • In your settings tab, add all the possible column names across the first row of your sheet. Name the columns as follows:
    • form_title
    • form_id
    • public_key
    • submission_url
    • default_language
    • version
    • instance_name
    • style
  • Set up encryption for your XLSForm template next. Although many people may not use encrypted forms, my recommendation if you are collecting beneficiary data for humanitarian or development projects is that you MUST protect their personal and sensitive data, so I would recommend you always use encryption on your forms.
    • Once you’ve created your private and public encryption keys for your team/project, and have stored your private key somewhere safe (don’t share this with anyone!), then copy and paste the public key into your settings tab under the “public_key” column.
  • Enter in the URL of your server into the “submission_url” column.
  • If you’re using multiple languages in most of your surveys, then add in your default language under the column “default_language”. If your data collectors collect the data all in a local language, then put the local language name here, so they don’t have to switch languages every time they fill out a new survey form.
  • You can have a naming convention for each new survey form that your data collectors submit. Enter the naming format into the column “instance_name”
    • For example, concat(${today}, ‘-‘, ${deviceid}, ‘-‘, uuid())
  • In the XLSForm template, leave “form_title” and “form_id” blank, because if they are blank, they will automatically show the name of your saved survey form. However, you can fill in an example form title and form id in your XLSForm template to remind you what to fill in when you’re creating a new survey.
    • For example, under form_title column, type in “Title in Collect App – Bilingual – عنوان ثنائي اللغة”
    • For example, under form_id column, type in “title_in_xml_english_version”

Download Now XLSForm Turquoise

5. Set up your “external_choices” sheet.

Step 5 Set up external_choices tab in XLSform Template

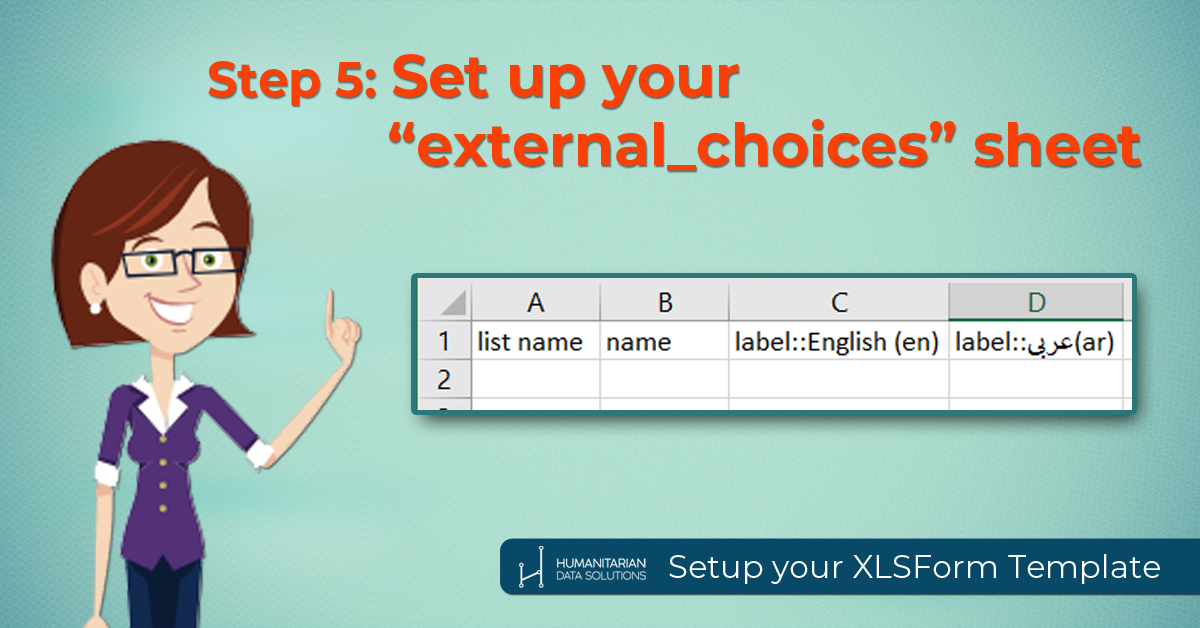
  • This tab is set up exactly like your “choices” tab.
  • You only need to use “external_choices” in some surveys when you have very big lists of selection choices. My recommendation is to set it up for your blank XLSForm template, but then when you’re creating a new survey, to delete this tab if it’s not needed.
  • In your external_choices tab, add all the possible column names across the first row of your sheet. Name the columns as follows:
    • list name
    • name
    • label
  • If you are using multiple languages in your blank XLSForm template, your “label” column can also be multi-lingual. Similarly to the “survey” tab, you can amend your “label” column name to be “label::English” (or whatever your primary language is), and then add additional columns with your additional languages.  You must spell these language names EXACTLY THE SAME as the languages you added in your “survey” tab.
Change column names with your primary language: Add new column names with your second language: Add new column names with your third language:
label::English label::عربى label::français


6. Finalize your Blank XLSForm Template and save it!

Step 6 Finalize and save the XLSform Template

  • You’ve now completed setting up your blank XLSForm template!
  • Press “save” and get going on creating new surveys faster!

Download Now XLSForm Navy

mobile device management social media apps

Mobile Device Management isn’t the Only Right Way

Humanitarian agencies should allow enumerators to use the data collection devices we give them for their own personal uses, not just for work purposes. (Yes, including their own pictures, personal chats, emails, and downloading apps). Agree?  Or do you think restrictive mobile device management is the way to go?

Today, I read the article “Can Mobile Device Management Improve the Data Collection Processes?” over at ICTWorks (go check it out after you read this article!)  It made the case for developing a mobile device management tool that would allow:

  • Data utilization management
  • Application blacklisting
  • Location tracking
  • Group notifications
  • Remote lock/unlock/wiping of devices

At first glance, this looks like a great solution.  It helps smartphones not run out of storage space or power too quickly.

There is a time and a place for every different management style.  And for some, using mobile device management might be the right solution.

However, I also want to give a different perspective that aid workers should consider before rushing in to control and restrict smartphone usage.  I just don’t want everyone to think that device management is “the only right way”.  There are very good reasons for NOT using device management as well…

First, allowing data collectors to use their smartphone for personal reasons means they’ll take care of it a little better.

When you give someone enough ownership over a piece of equipment that they treat it as their own, my experience is that they keep those devices charged, they keep them on hand at all times, and they stay in constant communication with you.

Second, if you allow your volunteers and staff to use the smart device for “personal stuff”, you can use it as an incentive.

When we mobilize hundreds of people at a time to collect data, we’re not only mobilizing employees.  We’re also mobilizing volunteers – community health volunteers, community hygiene promoters, etc.  It’s possible that they will provide even more value back to you through the data collection project if they see that you’re allowing them personal value out of the phone.  In some cases, what if you just give away smartphones to these volunteers after you finish your data collection project?  It doesn’t always make sense, depending on the life of the project and the life of the phones.  But it’s an idea to consider in lieu of salary costs, or as a way to maintain a massive network of future enumerators in case of emergency.

Third, it may be safer if a data collection app, such as ODK Collect or Kobo Collect, is only ONE of the apps on the phone in case that phone is confiscated in a sensitive operating area.

If you allow the enumerator to use the phone as a personal device, it could end up relieving suspicions and avoiding interrogations.

Fourth, while it makes sense for managers to want to track the location of all their devices, does it infringe on personal space? 

I can understand using location tracking if the devices are only taken out of the office during work hours.  But do your enumerators take the devices home at night? If so, there should probably be boundaries on when location tracking can be used.  The employee should have a right during non-business hours to not have their location tracked.

Fifth, does mobile device management restrict personalisation and innovation by individuals? 

If application downloads are blacklisted, does that mean that no one in your field team will be able to differentiate themselves by finding new creative tools with which to carry out their work? It’s like restricting Facebook at work – yes, Facebook CAN be a way to waste time at work.  However you can just as easily use it to connect with other professionals, network, and innovate together.  I would prefer to create a culture of innovation and trust rather than restricting access to anything I have not pre-approved.

In conclusion:

Regardless, I see all the pros of mobile device management tools as well. So I believe that in some contexts, using mobile device management is the way to go.  However, it’s not always the right solution.

Before you make a decision, you need to weigh the benefits against the cons.  Do you want to restrict and control device usage because of the mismanagement of the device by a couple of people?  Don’t punish the masses because of a couple of outliers.