Home » Kobo Toolbox

Tag: Kobo Toolbox

DIY Guide Blog Banner (9)

Prevent Selecting “None of the Above” with any Other Option – XLSForm Constraint Tutorial and Template

I want to share with you a useful XLSForm constraint that you can use when you create digital questionnaires for Kobo Toolbox, ODK, Ona, or SurveyCTO.  Someone recently asked me this question:

“How can I create a constraint such that respondents can’t select “I don’t know” and another option.  I want to create a constraint that prevents selecting “I don’t know” and any other option from a multiple_select question.”

This is such a good question.  And it is very common in humanitarian and development questionnaires, where we give a list of options and say “select ALL that apply”.  And then at the bottom of the list, we might have options like:

  • Not applicable
  • I don’t know
  • None of the above

But it wouldn’t make sense if the questionnaire allowed you to select “None of the above” with another option also.

So…there is a great constraint that you can use in your XLSForm to prevent this from happening.

Please watch this video to see the full explanation of how to create the constraint and how to construct the formula!

If you want to download the XLSForm Constraint Template, click here to go get your download.

Free Template Download

What this XLSForm Constraint is Trying to Prevent

  • We don’t want to allow anyone to select “none of the above” when they’ve selected any other answer.

Or we could also say…

  • We don’t want to allow anyone to select “none of the above” when they’ve selected more than one answer.

When we emphasise “more than one” answer, it indicates that part of the logic of our constraint will be looking at counting how many answers the respondent selected.  So let’s dig in…

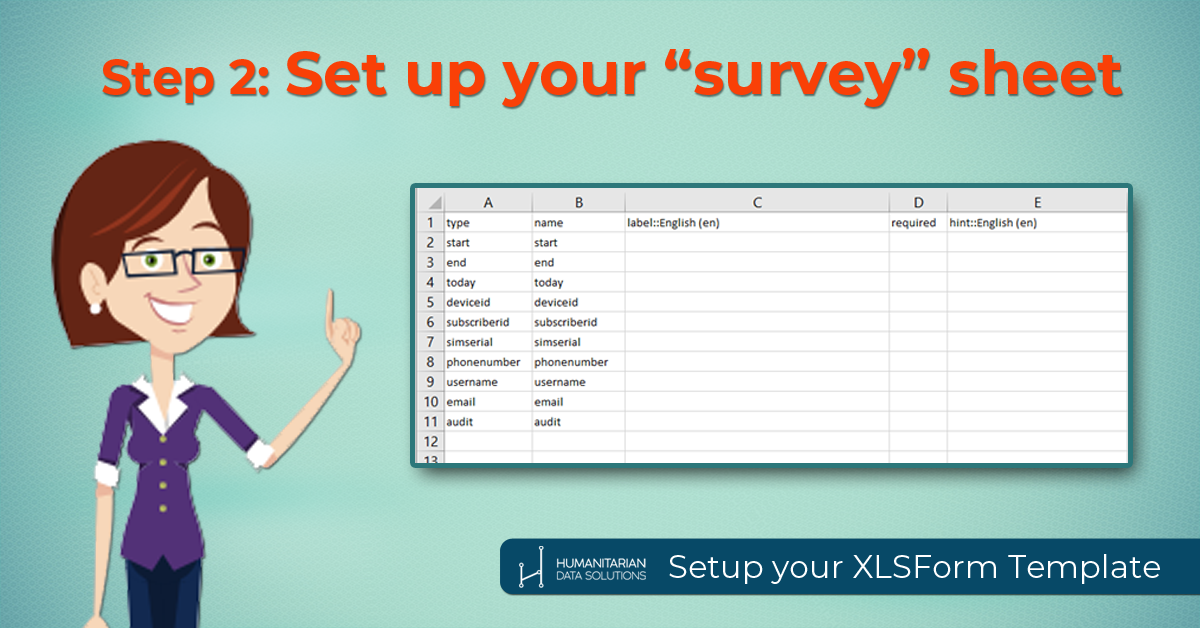
Set Up the Question in XLSForm

Slide2

The important elements of the question set-up are as follows:

  1. It applies to a “select_multiple” question
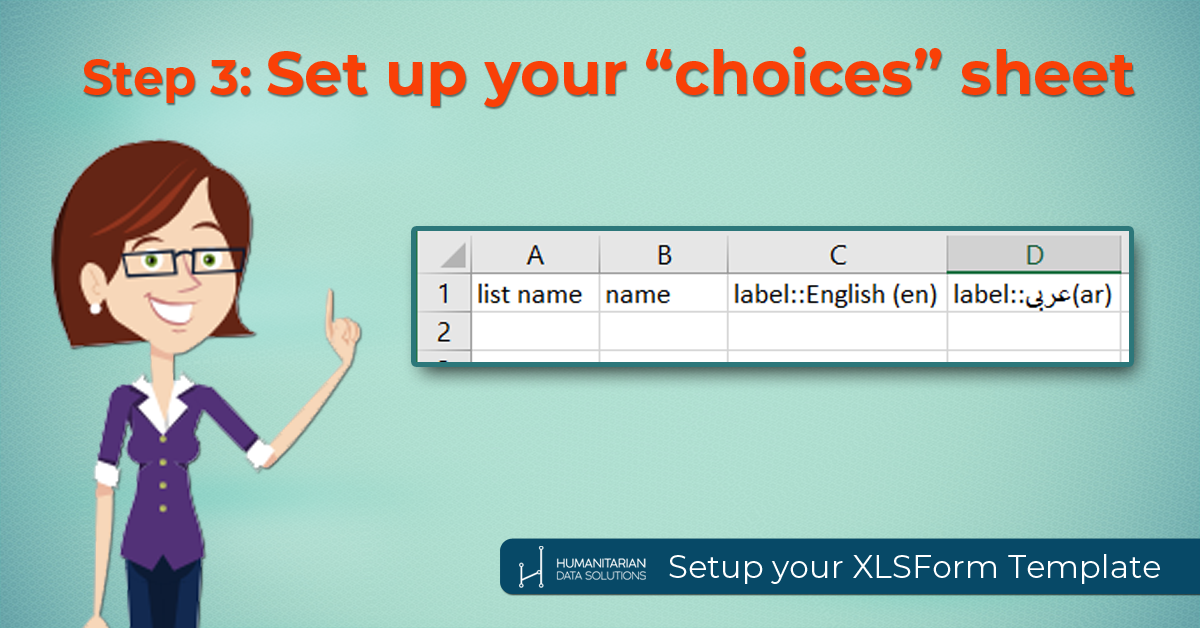
  2. The choice list is under the “choices” tab.
  3. Options include choices such as “I don’t know”, “none of the above”, or “not applicable”
  4. The respondent sees the “label” for each option when he or she fills out the questionnaire
  5. The “name” for each label – is the variable name used in the constraint to refer to that option

Two Parts to the XLSForm Constraint FormulaSlide3

The first part of the formula that you need to know is:

selected(.,'none')

You can read more about this function on the OpenDataKit website.  It means that the respondent selected the choice “none” in the question that they’re currently answering. The “.” refers to the answer currently being input into the questionnaire.

Slide4

The second part of the formula that you need to know is:

count-selected(.)>1

You can read more about this function on the OpenDataKit website.  However, the main interpretation is that the form will count how many choices were selected in the current question, and it will check if that count is greater than 1.

So there is a Problem when…

The problem occurs when the respondent has

selected(.,'none') and count-selected(.)>1

The “and” means both these things have to be true for the problem to exist.  So, if the respondent hasn’t selected none, then it’s okay if count-selected(.) is greater than one.

 Writing the Final XLSForm Constraint

You can use “not()” in the XLSForm constraint formula to show that this situation is “not allowed” to occur when the form is being filled out.  The full constraint formula is:

not(selected(.,'none') and count-selected(.)>1)

The interpretation of that formula in plain-English would be: you are “not allowed” to “select none” if you’ve “selected more than one choice”Slide10

Enter this formula into the “constraint” column of the XLSForm.  If you want to know how to create your own Blank XLSForm Template, you can learn how to here.

How To Collect A GPS Point YouTube Thumbnail

How to add a GPS question in a Kobo Form

This short tutorial is all about how to add a GPS data collection question to your Kobo Toolbox form.

Why collect GPS points?

  1. To show project locations or infrastructure locations on a map. To do that, the easiest way is to collect the GPS points so they can be easily added to a mapping software later.
  2. Verify the location that the data was collected from. Sometimes, you can use extra data, such as GPS points, timestamps, or images, for example, to verify that the data being collected is correct.  This is called data triangulation or verification.  And it’s very useful in humanitarian settings when you might need to prove to your donors or partners that your data is of high quality.

So how do you add a GPS question to your Kobo form?

Watch this video to find out!

Here are the steps to follow:

1. Set up a new data collection form

1. Set Up A New Data Collection Form

  1. From within Kobo Toolbox, click the big blue button that says “new”.
  2. Then click “build from scratch”.
  3. Give your new form a name, description, sector, and country, and then click “create”.
  4. You now have a blank form.

2. Create a GPS question

2. Create A GPS Question

  1. Now click the “plus” button, and type a question, such as “Please collect a GPS point.”
  2. Click “add question”.
  3. Then click “point” because it’s a point question.
  4. Now save the form.

3. Make the GPS Question Mandatory (if you want)

3. Make The Question Mandatory

  1. Press “settings” (the little gear icon) on the question that you’ve created.
  2. Make the question mandatory by clicking the tick box next to “mandatory response”.
  3. You can leave the tick box blank if it’s not mandatory for the data collector to fill out this question.
  4. Now save the project again and hit the “X” to exit.

4. Deploy the Form

4. Deploy The Form

  1. You’re now in your “Form” overview page.
  2. Next, click “deploy”.

5. Collect GPS Data using the Webform

5. Collect GPS Data Using The Webform

  1. Under the section “Collect data”, click on “open”.
  2. You will now see the webform.
  3. Your web browser should ask permission to know your location.  Click “allow”.
  4. Now, click the little locator button that says “detect current location”. It will input the latitude and longitude as well as accuracy of your location.
  5. Now scroll down and click “submit”.

6. Collect GPS Data using your Mobile Phone

6. Collect GPS Data Using ODK Collect App

  1. Open the ODK Collect app (or Kobo Collect app) on your phone, and tap “get blank form”.
  2. The app will connect to the server.  Choose the “GPS question” form and tap “get selected”.
  3. Once it downloads the form, hit okay.
  4. Tap on “fill blank form” and then tap on the “GPS question” form.
  5. Collect a geopoint by tapping on the grey button within your form.
  6. Once your phone has connected with the satellites, tap “save geopoint”.
  7. Swipe forward, then tap on “save form and exit”.

And that’s it. That’s how you can create a GPS question using the Kobo Toolbox Form Builder, and then fill that in either using a webform or using a phone app such as ODK Collect.


You might be interested in checking out a couple other mobile data collection articles:

8 Ways to Check your Data Quality when using ODK or Kobo

Mobile Data Collection isn’t only for Surveys…11 Ideas for your Team


Intro YouTube Thumbnail

Analyse ODK Multiple Choice Questions Easily

A question that almost every person eventually asks when working with Kobo Toolbox or ODK is:  how do I easily analyse ODK multiple choice, or “select_multiple” questions from ODK?

What’s the Problem analysing ODK Multiple Choice?

When you use ODK or Kobo Toolbox to collect multiple choice answers (using “select_multiple” question type), all the answers are stored in a single column in the .csv output file.  The answers are simply separated by a space in that column.  In order to analyze the output, the answers need to be broken out into individual columns (something that Kobo Toolbox does very nicely in their output file).

But even then, you have to produce a different bar chart or pie chart for each individual answer.  You still can’t show all the answers on a single bar chart.  You first need to combine the data back into a single column and link it back to the main table with a primary key….oooooohhhh, it’s complicated!!!

What’s the Solution?

Many of you probably use Excel (or [R] or SPSS or Stata  or PowerBI) to analyse your ODK or Kobo data.  One of the easiest ways to analyse this data is to use the FREE software Qlik Sense Desktop.  In this article you’ll see how to create a simple Qlik dashboard (where you can analyse and visualize the ODK data in one software) of select_multiple data.

If you’re serious about learning this – it will probably take you 1-2 hours to work through this tutorial.  But once you’ve done it, it will save you hours upon hours of time (and frustration) in the future.

Benefits of Using Qlik Sense instead of Excel:

  • You don’t touch the raw data.  You do the analysis right inside a Qlik script.
  • It’s easy to modify your script or analysis if anything changes
  • Once you set up the script, you can apply it to new raw data downloads for automatic analysis.

Step 1: Download Qlik Sense Desktop if you haven’t already

Seriously, you’ll hate it for the first three days while you get used to it.  And then you’ll LOVE it for how easy it is to analyse ODK or Kobo data once you have learned the basics.  The free download of Qlik Sense is here.

Step 2:  Load your ODK .csv file into Qlik

This video shows you how to use the Qlik script editor to load data from Kobo or ODK.

Step 3: Split “select_multiple” answers into individual values using “subfield” in Qlik

This step is where the magic happens.  It might seem scary to manage data using computer coding, but just follow my steps exactly – and you’ll be amazed.

Step 4: Analyse data/timestamps using Qlik

Make a “Filter”, a “KPI” and a bar chart of survey dates in this video.

Step 5: Replace ODK “code names” with full “Labels” that show up in your dashboard

This step is a bit complicated.  So stick with it to the end.  It’s really worth learning this!

Step 6: Make bar charts that show percentages instead of absolute values

When you’re displaying results from a survey, you probably want to show “% of households” that showed a behaviour.

Step 7: Finalize your dashboard

Change the colour, tweak the titles, and share your dashboard with your friends and team!


Check out these other Tutorials:

How to create xlsform template

How to Setup a Blank XLSForm Template

When you first start to design a digital questionnaire in XLSForm – which works for ODK, ONA, SurveyCTO, and many other mobile data collection apps – then you probably want to have a blank XLSForm template setup and ready to go.

Setting up a blank XLSForm template means that when you need to create a new survey for your team, you can get started right away.  It’s so easy, saves time, and makes your work flow so much faster!  You’ll look very professional in front of your colleagues (and your boss!).

Before we start – you can download our free template so you don’t have to create one from scratch!!Download Now XLSForm Navy

1.  Set up your XLSform tabs

Step 1 set up your xlsform tabs

  • Open a new Excel spreadsheet
  • Save it as “Blank XLSForm Template”
  • Create 4 tabs in your workbook and name them as follows
    • survey
    • choices
    • settings
    • external_choices

2. Set up your “survey” sheet.

Step 2 set up your survey sheet on xlsform template

  • In your survey tab, add all the possible column names across the first row of your sheet. Name the columns as follows:
    • type
    • name
    • label
    • required
    • hint
    • constraint
    • constraint_message
    • relevant
    • required_message
    • calculation
    • repeat_count
    • appearance
    • choice_filter
    • default
    • read_only
    • media::image
    • media::audio
    • media::video
    • body::accuracyThreshold

Download Now XLSForm Green

  • ODK keeps adding new column names to their software so that it has enhanced capabilities. Just in case they’ve added new columns recently, go check out the most up-to-date list of XLSForm column names in their documentation.
  • Set up your XLSForm template for multiple languages. In your survey tab, these are columns that can be translated into multiple languages:
    • label
    • hint
    • constraint_message
    • required_message
    • media::image
    • media::audio
    • media::video
  • If you frequently create surveys in more than one language, then amend those column names to show your primary language, and create additional column names with your language variations.
Column names (multiple languages: showing English, Arabic, and French)
Change column names with your primary language: Add new column names with your second language: Add new column names with your third language:
label::English label::عربى label::français
hint::English hint::عربى hint::français
constraint_message::English constraint_message::عربى constraint_message::français
required_message::English required_message::عربى required_message:: français
media::image::English media::image::عربى media::image:: français
media::audio::English media::audio::عربى media::audio:: français
media::video::English media::video::عربى media::video:: français
  • Now set up your “metadata” questions in your survey tab. These questions should be included on every new survey you create. That way you won’t forget to capture all the data possible about when each form was filled out and which device filled it out.
    • Under the “type” column and the “name” column, put in the following questions:
type name
start start
end end
today today
deviceid deviceid
subscriberid subscriberid
simserial simserial
phonenumber phonenumber
username username
email Email
audit audit
  • A new feature that ODK has recently added to their software is the ability to add an “audit” feature to surveys, which captures details about how a data collector moves through a form and how long each question takes, for example. In order for this piece of metadata to work, you need to be using ODK Aggregate 1.5.0+ as your server.

3. Set up your “choices” sheet.

Step 3 Set up choices tab in XLSform Template

  • In your choices tab, add all the possible column names across the first row of your sheet. Name the columns as follows:
    • list name
    • name
    • label
  • If you are using multiple languages in your XLSForm template, your “label” column can also be multi-lingual. Similarly to the “survey” tab, you can amend your “label” column name to be “label::English” (or whatever your primary language is), and then add additional columns with your additional languages.  You must spell these language names EXACTLY THE SAME as the languages you added in your “survey” tab.
Change column names with your primary language: Add new column names with your second language: Add new column names with your third language:
label::English label::عربى label::français

4. Set up your “settings” sheet.

Step 4 Set up settings tab in XLSform Template

  • In your settings tab, add all the possible column names across the first row of your sheet. Name the columns as follows:
    • form_title
    • form_id
    • public_key
    • submission_url
    • default_language
    • version
    • instance_name
    • style
  • Set up encryption for your XLSForm template next. Although many people may not use encrypted forms, my recommendation if you are collecting beneficiary data for humanitarian or development projects is that you MUST protect their personal and sensitive data, so I would recommend you always use encryption on your forms.
    • Once you’ve created your private and public encryption keys for your team/project, and have stored your private key somewhere safe (don’t share this with anyone!), then copy and paste the public key into your settings tab under the “public_key” column.
  • Enter in the URL of your server into the “submission_url” column.
  • If you’re using multiple languages in most of your surveys, then add in your default language under the column “default_language”. If your data collectors collect the data all in a local language, then put the local language name here, so they don’t have to switch languages every time they fill out a new survey form.
  • You can have a naming convention for each new survey form that your data collectors submit. Enter the naming format into the column “instance_name”
    • For example, concat(${today}, ‘-‘, ${deviceid}, ‘-‘, uuid())
  • In the XLSForm template, leave “form_title” and “form_id” blank, because if they are blank, they will automatically show the name of your saved survey form. However, you can fill in an example form title and form id in your XLSForm template to remind you what to fill in when you’re creating a new survey.
    • For example, under form_title column, type in “Title in Collect App – Bilingual – عنوان ثنائي اللغة”
    • For example, under form_id column, type in “title_in_xml_english_version”

Download Now XLSForm Turquoise

5. Set up your “external_choices” sheet.

Step 5 Set up external_choices tab in XLSform Template

  • This tab is set up exactly like your “choices” tab.
  • You only need to use “external_choices” in some surveys when you have very big lists of selection choices. My recommendation is to set it up for your blank XLSForm template, but then when you’re creating a new survey, to delete this tab if it’s not needed.
  • In your external_choices tab, add all the possible column names across the first row of your sheet. Name the columns as follows:
    • list name
    • name
    • label
  • If you are using multiple languages in your blank XLSForm template, your “label” column can also be multi-lingual. Similarly to the “survey” tab, you can amend your “label” column name to be “label::English” (or whatever your primary language is), and then add additional columns with your additional languages.  You must spell these language names EXACTLY THE SAME as the languages you added in your “survey” tab.
Change column names with your primary language: Add new column names with your second language: Add new column names with your third language:
label::English label::عربى label::français


6. Finalize your Blank XLSForm Template and save it!

Step 6 Finalize and save the XLSform Template

  • You’ve now completed setting up your blank XLSForm template!
  • Press “save” and get going on creating new surveys faster!

Download Now XLSForm Navy

8 Ways to Check Data Quality using MDC

8 Ways to Check your Data Quality when using ODK or KOBO

Better data quality is one of the key benefits of mobile data collection.  You can run more in-depth checks on data entry quality as the survey is being carried out on a daily basis (not waiting until the end of the survey)!

Here’s a quick list of the top 8 ways to check the quality of your incoming data from your mobile survey:

Download Now Data Quality Navy

Data Quality Check #1: Length of Time to Finish Each Survey

Data Quality Check #1 time

  • To check this, subtract the start time of the form to the end time of the form, and see the overall time.
  • Why does this matter? An enumerator who is filling in data too quickly (or taking too long) may be filling in data dishonestly.  Not always the case, but at least it flags anomalies that you can go and check out in person.
  • ODK has three ways for you to track timestamps through a form –
    • start and end times for a form being filled,
    • a timestamp collected the first time they go to a particular question (click to find out how to collect timestamps in your XLSForm)
    • a full audit on your ODK form – where a .csv file is produced at the end of the questionnaire being finalized that gives you full details on how an enumerator filled out a form, and when they accessed every single question.

Data Quality Check #2: Collecting GPS Points

Data Quality Check #2 GPS

  • Check what percentage of the time your enumerators are collecting GPS.  If Enumerator X only collected 15% GPS points, while all other enumerators collected 95%+ GPS points – what’s going on with Enumerator X?)
  • ODK is working on a feature to collect GPS in the background (as part of the metadata of the form) instead of making GPS collection an explicit question in the interview. You may fear that this does not give enough control to the enumerator in the context.  Sometimes GPS collection is controversial in your context.  Therefore, use this feature wisely.

Data Quality Check #3: Random Distribution of GPS Points

Data Quality Check #3 GPS random

  • If you’re doing a random household survey, you’ll want to check for randomness in the location of the households surveyed. Collect GPS at each interview location, and then throw these points onto a map and check their randomness visually.
  • Watch out for points all along a straight line (a road).  Maybe an enumerator simply walked down a single road collecting data. If you’re trying to collect random, representative data, then this kind of data collection will not give you a random or overall view of the entire population of that community or location.
  • It’s easiest to do this kind of visual check with aerial imagery in the background of your map.

Data Quality Check #4: Gender Ratios

Data Quality Check #4 gender ratio

  • If you are doing a random survey (with truly random interviewee selection methodologies), and you’re collecting complete gender data on your population, you should end up with a 50/50 split between male and female. Perhaps you’ll get a 48/52 split, maaaayyybe a 47/53 split – but that is probably the max.  If you’re showing a 45/55 split, or a 40/60 split – you’ve got some issues with the random selection methodology.
  • The great thing about mobile data collection is that you can check these ratios daily. And if, by half-way through the survey, those numbers aren’t about 50/50, you can pause the survey midway and fix whatever the problem is.

Download Now Data Quality Turquoise

Data Quality Check #5: Bell Curves look ‘Normal’

Data Quality Check #5 bell curves

  • Many collected datasets will show some sort of a bell-curve – probably a skewed bell-curve. You might notice “spikes” in your curve.  Or you might notice how values along your dataset “jump” suddenly.  If you see this, then you might want to look a little more closely into these non-normal data distributions.
  • For example, we as humans tend towards entering numbers that are rounded off to factors of 5. So if you see spikes at “5, 10, 15, 20”, etc, then you’re most likely seeing human bias in number entry. (Human bias in this example is numbers being rounded up or down to the nearest 5).
  • You might also notice a jump in the dataset if a data entry assistant is skewing the data purposely. For example, if people get a benefit with a score of 50 or above, you may have scores that are artificially skewed towards being above 50.  Watch out for these signs of untruthful data collection.
  • Remember – the person entering data may not even realize they’re doing it! So if you notice this human bias showing up in your numbers, then ask yourself – Why, Why Why??  Get to the bottom of it.  Re-train your team so that they understand how bias causes problems in the data.  Train them on how to remain unbiased during their surveys.

Data Quality Check #6: Re-Interview People by Phone

Data Quality Check #6 phone back

  • It’s tough to do monitoring of a survey. Most of our monitoring and evaluation efforts exist to check up on physical programmes, activities, being run in a community.  However monitoring of a survey is good practice, as well.  One of the ways you can monitor the implementation of a survey is to randomly select some interviewees and phone them up to double-check a few things.
    • Where were they interviewed? (Does the location match where they were supposed to be interviewed according to the survey methodology?)
    • Ask them three or four questions from the survey to see if you get the same answers as what the enumerator entered into the form.
  • To do this, collect the first name of the interviewee, a phone number from them, and consent that you can call them for monitoring purposes.
    • Names and numbers are personal, sensitive, data, and must be protected! When you collect personal and sensitive data, you’ve got to make sure you’ve got good data protection practices in place.  Here’s a list of 27 tips for good data protection for humanitarian teams.

Data Quality Check #7: Unique Beneficiary Signatures

Data Quality Check #7 signatures unique

  • If you are collecting beneficiary signatures using XLSForm, then do a quick visual comparison of all the signatures collected by opening up the media folder. Are the signatures unique?  Or do they all look pretty similar?  If all the signatures are similar, then you might want to check that the enumerators know to collect the beneficiary signature.  Make sure they aren’t just putting their own signature down on the form.

Data Quality Check #8: Photo Evidence

Data Quality Check #8 photos

  • One great way to add evidence to your survey is to collect one or two photos with the survey. You can always give enumerators the option not to collect photos.  You can do a quality check to see which enumerators are collecting photo evidence regularly vs. hardly at all.
  • There is an option in ODK that you force the form to collect a NEW picture right then and there, instead of giving the option to the enumerator to select a previously-collected picture to use in the survey. Use this option if you want to ensure that pictures are taken at the exact moment the question appears.

Download Now Data Quality Green